
If you are a Grinder who has said to himself, “Man – this website we have is tits, but I don’t get what some of these dumb stats OMJ posts on here are.” Then this blog is for you!
WAP (aka “What’s a Pass?”) (aka %TmFGA)
Formula: Field Goals Attempted/Total Team Field Goals Attempted (FGA/TmFGA)
Why highlight it? We like to highlight guys who shoot a lot.
GAPE (aka Grinders Analytical Performance Evaluation… or something like that)
Formula: (Points+Rebounds+Assists+Steals+Blocks-Turnovers-Air Balls – Missed Shots)
Why highlight it? This is the Grinders version of the NBA’s Player Efficiency Rating stat.
Hero (aka %TmGAPE)
Formula: (GAPE/TmGAPE)
Why Highlight it? This stat generally highlights the Grinder who ends up being the “go-to-guy” on a team. In theory, you could use this stat to help indicate who the most valuable players are to their teams.
Examples of Hero’s:
Last week, Chris Cole had a GAPE of 19. Not bad! His team had a total GAPE of 22. That’s bad! Chris was the hero of the week because he literally was the only guy who did anything for his team, statistically speaking (19/22 = 86.4%). That’s an unusually high Hero% though.
Most season leaders have been slightly over .500 (Tall Justin, Curtis, Gersitz, etc – all-around excellent Grinders).
Game Score (aka GmScore)
Formula: The average of:
- FG%/.500
- Pts/20
- Rebounds/10
- (Assists+Steals+Blocks-TOs-Air Balls)/10
Why highlight it? The highest Game Score = Best individual all-around performance, based on benchmarks for each of the above.
Example 1:
In a typical “good OMJ game”, he goes 3/4, 6 points, 4 rebounds, 2 assists and 3 turnovers – his Game Score:
- .750/.500 = 150%
- 6/20 = 33.3%
- 4/10 = 40%
- (2-3=-1) -1/10 = -10%
- GmScore = Average of 150, 33.3, 40, and -10. = 53.35
- That’s fine, but not great.
Also – a Grinder can sometimes just be really good at everything. The example below – Chaz shoots 40% from the floor but scores a ton and does a lot of other good stuff.
Example 2:
- Chaz shoots 12/30, for 30 points (he hits 6 threes), has 20 rebounds, throws in 1 block, 2 steals, 7 assists, has 4 turnovers, and air balls 2.
- 12/30=40%, 40%/50%=80%
- 30/20 = 166%
- 20/10 = 200%
- (1+2+7-4-2)= 4, 4/10 = 40%
- GmScore = Average of 80, 166, 200, and 40. = 121.5
- That’s really excellent, despite the turnovers and airballs.
Here’s more examples in Table form:
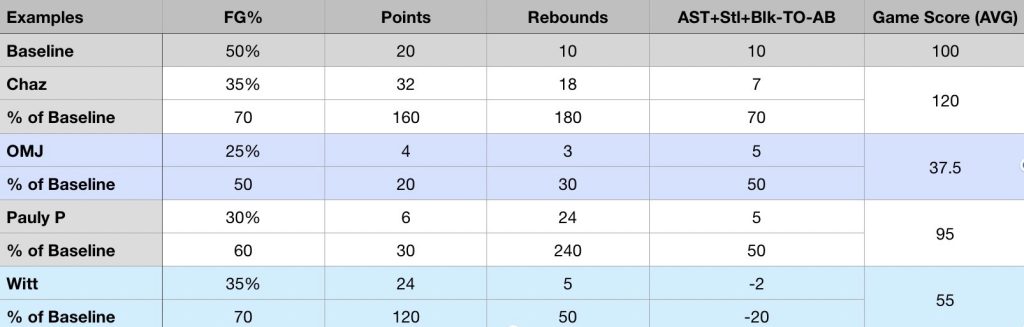
Check it out for yourself. Grinders are ranked in order on the stats leader pages based on this stat. Check out the career stats, or previous season stats. I feel pretty good about the order the top guys are in (and the bottom guys for that matter), as far as who was the best and worst. Of course – there is always going to be debate, but this stat without fault puts the top guys at the top.